Unlocking Insights - Mastering Time Series Analysis with Timeseries Value Symbol

Enhancing Time Series Data Viewing with the Timeseries Value Symbol
In data visualization, there's often a necessity to inspect timeseries data in a textual format rather than solely relying on visual trends. This is where the Timeseries Value symbol comes into play, offering a versatile solution for such use-cases. Archived values for a point or attribute can be displayed in ascending or descending order, offering flexibility in how your see the data. Sorting options are conveniently accessible through a click on the sort icon adjacent to the Timestamp header. Moreover, the symbol allows for the customization of the displayed data items, offering control over the number of results shown.

Tailoring to Your Needs
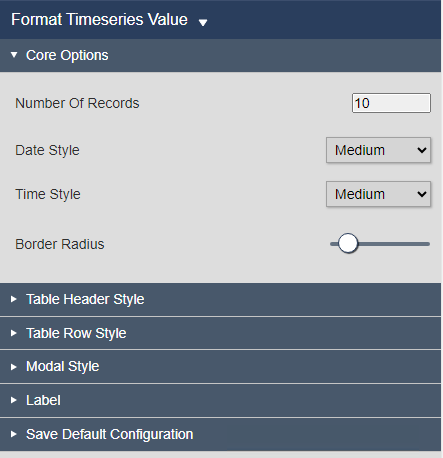
The strength of the Timeseries Value symbol lies in its extensive customizability. With over 50 configuration options available, you can tailor the symbol to seamlessly integrate with your existing displays or align with your company's branding. Additionally, the symbol supports default configuration settings to streamline consistency across deployments of the symbol, ensuring a uniform appearance without the need to adjust individual parameters.
Flexible Column Settings
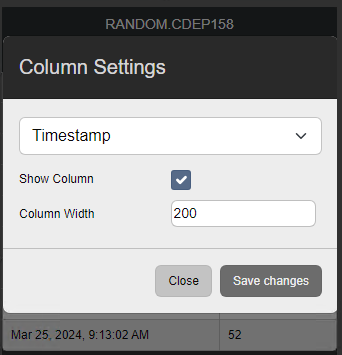
Introducing modal usage with symbols marks a significant advancement in enhancing user experience, allowing for the display or concealment of additional symbol components as needed. In this iteration, column settings have been relocated to a modal interface to accommodate this functionality. Within the modal, users can define column visibility and width settings, offering a straightforward approach to customizing the display layout. While the method may differ from traditional column resizing, it provides enhanced flexibility and simplicity in managing column configurations.
Delve into the Symbol
Experience firsthand the innovation behind our Timeseries Value symbol for PI Vision by exploring its codebase here.
Conclusion
The Timeseries Value symbol represents a powerful tool for efficiently analyzing timeseries data within PI Vision. Its intuitive interface, coupled with extensive customization options, empowers users to extract insights effectively. By embracing modal usage and flexible column settings, this symbol sets a new standard for data visualization versatility. Dive into the realm of possibilities with the Timeseries Value symbol and elevate your data exploration experience.